Quinapondan | |
|---|---|
| Municipality of Quinapondan | |
 Flag | |
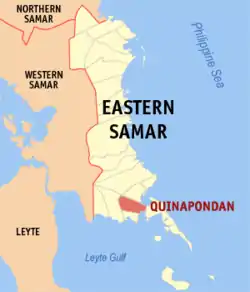 Map of Eastern Samar with Quinapondan highlighted | |
OpenStreetMap | |
.svg.png.webp) Quinapondan Location within the Philippines | |
| Coordinates: 11°09′28″N 125°31′15″E / 11.1578°N 125.5208°E | |
| Country | Philippines |
| Region | Eastern Visayas |
| Province | Eastern Samar |
| District | Lone district |
| Barangays | 25 (see Barangays) |
| Government | |
| • Type | Sangguniang Bayan |
| • Mayor | Raffy S. Asebias |
| • Vice Mayor | Leo Jasper M. Candido |
| • Representative | Maria Fe R. Abunda |
| • Councilors | List |
| • Electorate | 10,686 voters (2022) |
| Area | |
| • Total | 83.24 km2 (32.14 sq mi) |
| Elevation | 45 m (148 ft) |
| Highest elevation | 318 m (1,043 ft) |
| Lowest elevation | 0 m (0 ft) |
| Population (2020 census)[3] | |
| • Total | 14,507 |
| • Density | 170/km2 (450/sq mi) |
| • Households | 3,605 |
| Economy | |
| • Income class | 5th municipal income class |
| • Poverty incidence | 51.27 |
| • Revenue | ₱ 107.3 million (2020) |
| • Assets | ₱ 321.3 million (2020) |
| • Expenditure | ₱ 104 million (2020) |
| • Liabilities | ₱ 74.62 million (2020) |
| Service provider | |
| • Electricity | Eastern Samar Electric Cooperative (ESAMELCO) |
| Time zone | UTC+8 (PST) |
| ZIP code | 6808 |
| PSGC | |
| IDD : area code | +63 (0)55 |
| Native languages | Waray Tagalog |
| Website | quinapondan-esamar |
Quinapondan (IPA: [ˌkinɐˈpondan]), officially the Municipality of Quinapondan (Waray: Bungto han Quinapondan; Tagalog: Bayan ng Quinapondan), is a 5th class municipality in the province of Eastern Samar, Philippines. According to the 2020 census, it has a population of 14,507 people.[3]
Geography
Barangays
Quinapondan is politically subdivided into 25 barangays. [5] Each barangay consists of puroks and some have sitios.
- Barangay Anislag
- Bagte
- Barangay No. 1 (Poblacion)
- Barangay No. 2 (Poblacion)
- Barangay No. 3 (Poblacion)
- Barangay No. 4 (Poblacion)
- Barangay No. 5 (Poblacion)
- Buenavista
- Caculangan
- Cagdaja
- Cambilla
- Cantenio
- Naga
- Paco
- Rizal (Pana-ugan)
- San Pedro
- San Vicente
- Santa Cruz (Loro Diyo)
- Santa Margarita
- Santo Niño
- Palactad (Valley)
- Alang-alang
- Barangay No. 6 (Poblacion)
- Barangay No. 7 (Poblacion)
- San Isidro
Climate
| Climate data for Quinapondan, Eastern Samar | |||||||||||||
|---|---|---|---|---|---|---|---|---|---|---|---|---|---|
| Month | Jan | Feb | Mar | Apr | May | Jun | Jul | Aug | Sep | Oct | Nov | Dec | Year |
| Mean daily maximum °C (°F) | 28 (82) |
28 (82) |
29 (84) |
30 (86) |
30 (86) |
30 (86) |
29 (84) |
30 (86) |
30 (86) |
29 (84) |
29 (84) |
28 (82) |
29 (84) |
| Mean daily minimum °C (°F) | 22 (72) |
22 (72) |
22 (72) |
23 (73) |
24 (75) |
24 (75) |
24 (75) |
24 (75) |
24 (75) |
24 (75) |
23 (73) |
23 (73) |
23 (74) |
| Average precipitation mm (inches) | 90 (3.5) |
67 (2.6) |
82 (3.2) |
70 (2.8) |
97 (3.8) |
145 (5.7) |
152 (6.0) |
127 (5.0) |
132 (5.2) |
152 (6.0) |
169 (6.7) |
144 (5.7) |
1,427 (56.2) |
| Average rainy days | 17.0 | 13.5 | 16.0 | 16.5 | 20.6 | 24.3 | 26.0 | 25.4 | 25.2 | 26.4 | 23.0 | 21.1 | 255 |
| Source: Meteoblue[6] | |||||||||||||
Demographics
| Year | Pop. | ±% p.a. |
|---|---|---|
| 1903 | 2,194 | — |
| 1948 | 8,204 | +2.97% |
| 1960 | 9,173 | +0.93% |
| 1970 | 9,180 | +0.01% |
| 1975 | 10,530 | +2.79% |
| 1980 | 11,355 | +1.52% |
| 1990 | 10,986 | −0.33% |
| 1995 | 12,644 | +2.67% |
| 2000 | 11,721 | −1.61% |
| 2007 | 12,339 | +0.71% |
| 2010 | 13,841 | +4.27% |
| 2015 | 14,779 | +1.26% |
| 2020 | 14,507 | −0.36% |
| Source: Philippine Statistics Authority[7][8][9][10] | ||
The population of Quinapondan in the 2020 census was 14,507 people,[3] with a density of 170 inhabitants per square kilometre or 440 inhabitants per square mile.
Economy
Poverty Incidence of Quinapondan
References
- ↑ Municipality of Quinapondan | (DILG)
- ↑ "2015 Census of Population, Report No. 3 – Population, Land Area, and Population Density" (PDF). Philippine Statistics Authority. Quezon City, Philippines. August 2016. ISSN 0117-1453. Archived (PDF) from the original on May 25, 2021. Retrieved July 16, 2021.
- 1 2 3 Census of Population (2020). "Region VIII (Eastern Visayas)". Total Population by Province, City, Municipality and Barangay. Philippine Statistics Authority. Retrieved 8 July 2021.
- ↑ "PSA Releases the 2018 Municipal and City Level Poverty Estimates". Philippine Statistics Authority. 15 December 2021. Retrieved 22 January 2022.
- ↑ "Province: Eastern Samar". PSGC Interactive. Quezon City, Philippines: Philippine Statistics Authority. Retrieved 12 November 2016.
- ↑ "Quinapondan, Eastern Samar : Average Temperatures and Rainfall". Meteoblue. Retrieved 31 December 2018.
- ↑ Census of Population (2015). "Region VIII (Eastern Visayas)". Total Population by Province, City, Municipality and Barangay. Philippine Statistics Authority. Retrieved 20 June 2016.
- ↑ Census of Population and Housing (2010). "Region VIII (Eastern Visayas)" (PDF). Total Population by Province, City, Municipality and Barangay. National Statistics Office. Retrieved 29 June 2016.
- ↑ Censuses of Population (1903–2007). "Region VIII (Eastern Visayas)". Table 1. Population Enumerated in Various Censuses by Province/Highly Urbanized City: 1903 to 2007. National Statistics Office.
{{cite encyclopedia}}: CS1 maint: numeric names: authors list (link) - ↑ "Province of Eastern Samar". Municipality Population Data. Local Water Utilities Administration Research Division. Retrieved 17 December 2016.
- ↑ "Poverty incidence (PI):". Philippine Statistics Authority. Retrieved December 28, 2020.
- ↑ "Estimation of Local Poverty in the Philippines" (PDF). Philippine Statistics Authority. 29 November 2005.
- ↑ "2003 City and Municipal Level Poverty Estimates" (PDF). Philippine Statistics Authority. 23 March 2009.
- ↑ "City and Municipal Level Poverty Estimates; 2006 and 2009" (PDF). Philippine Statistics Authority. 3 August 2012.
- ↑ "2012 Municipal and City Level Poverty Estimates" (PDF). Philippine Statistics Authority. 31 May 2016.
- ↑ "Municipal and City Level Small Area Poverty Estimates; 2009, 2012 and 2015". Philippine Statistics Authority. 10 July 2019.
- ↑ "PSA Releases the 2018 Municipal and City Level Poverty Estimates". Philippine Statistics Authority. 15 December 2021. Retrieved 22 January 2022.
External links
- Philippine Standard Geographic Code
- Philippine Census Information
- Local Governance Performance Management System
Places adjacent to Quinapondan | ||||||||||||||||
|---|---|---|---|---|---|---|---|---|---|---|---|---|---|---|---|---|
| ||||||||||||||||
Borongan (capital and largest city) | |
| Municipalities | |
| Component city | |
This article is issued from Wikipedia. The text is licensed under Creative Commons - Attribution - Sharealike. Additional terms may apply for the media files.