Pila-Canale | |
|---|---|
 A general view of Pila-Canale | |
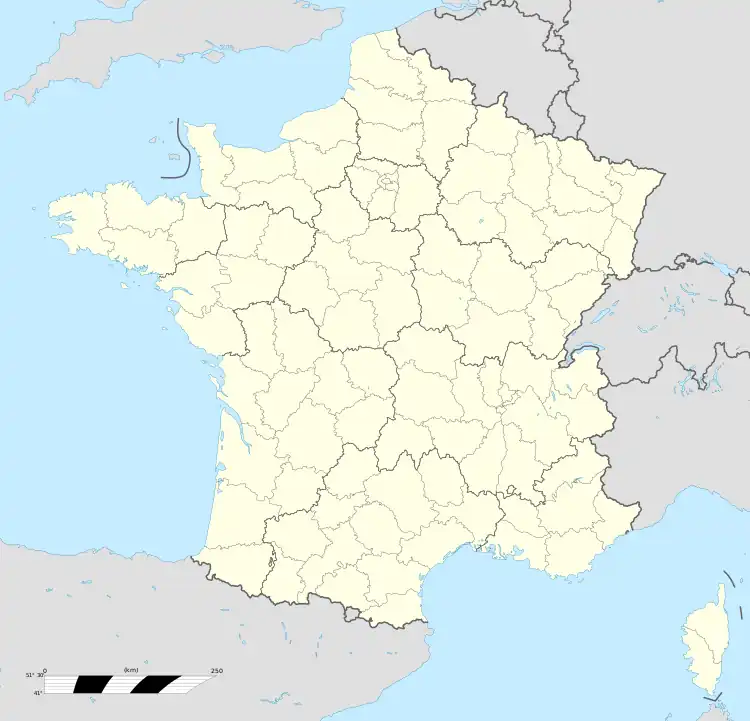
Location of Pila-Canale | |
 Pila-Canale  Pila-Canale | |
| Coordinates: 41°48′49″N 8°54′37″E / 41.8136°N 8.9103°E | |
| Country | France |
| Region | Corsica |
| Department | Corse-du-Sud |
| Arrondissement | Ajaccio |
| Canton | Taravo-Ornano |
| Government | |
| • Mayor (2020–2026) | Emmanuel Guglielmi[1] |
| Area 1 | 18.8 km2 (7.3 sq mi) |
| Population | 277 |
| • Density | 15/km2 (38/sq mi) |
| Time zone | UTC+01:00 (CET) |
| • Summer (DST) | UTC+02:00 (CEST) |
| INSEE/Postal code | 2A232 /20123 |
| Elevation | 13–561 m (43–1,841 ft) (avg. 350 m or 1,150 ft) |
| 1 French Land Register data, which excludes lakes, ponds, glaciers > 1 km2 (0.386 sq mi or 247 acres) and river estuaries. | |
Pila-Canale is a commune in the Corse-du-Sud department of France on the island of Corsica.

Geography
Climate
Pila-Canale has a mediterranean climate (Köppen climate classification Csa). The average annual temperature in Pila-Canale is 15.4 °C (59.7 °F). The average annual rainfall is 864.7 mm (34.04 in) with November as the wettest month. The temperatures are highest on average in August, at around 24.4 °C (75.9 °F), and lowest in January and February, at around 8.3 °C (46.9 °F). The highest temperature ever recorded in Pila-Canale was 41.4 °C (106.5 °F) on 23 July 2009; the coldest temperature ever recorded was −4.1 °C (24.6 °F) on 31 January 1999.
| Climate data for Pila-Canale (1981–2010 averages, extremes 1992−present) | |||||||||||||
|---|---|---|---|---|---|---|---|---|---|---|---|---|---|
| Month | Jan | Feb | Mar | Apr | May | Jun | Jul | Aug | Sep | Oct | Nov | Dec | Year |
| Record high °C (°F) | 19.7 (67.5) |
23.7 (74.7) |
27.1 (80.8) |
29.2 (84.6) |
34.0 (93.2) |
38.0 (100.4) |
41.1 (106.0) |
41.4 (106.5) |
36.3 (97.3) |
31.7 (89.1) |
25.7 (78.3) |
22.2 (72.0) |
41.4 (106.5) |
| Mean daily maximum °C (°F) | 11.5 (52.7) |
11.9 (53.4) |
14.3 (57.7) |
16.6 (61.9) |
22.0 (71.6) |
26.2 (79.2) |
29.8 (85.6) |
29.9 (85.8) |
24.9 (76.8) |
20.8 (69.4) |
15.6 (60.1) |
12.2 (54.0) |
19.7 (67.5) |
| Daily mean °C (°F) | 8.3 (46.9) |
8.3 (46.9) |
10.3 (50.5) |
12.6 (54.7) |
17.3 (63.1) |
21.0 (69.8) |
24.0 (75.2) |
24.4 (75.9) |
20.2 (68.4) |
16.9 (62.4) |
12.3 (54.1) |
9.2 (48.6) |
15.4 (59.7) |
| Mean daily minimum °C (°F) | 5.2 (41.4) |
4.8 (40.6) |
6.4 (43.5) |
8.5 (47.3) |
12.7 (54.9) |
15.7 (60.3) |
18.3 (64.9) |
18.9 (66.0) |
15.4 (59.7) |
12.9 (55.2) |
9.0 (48.2) |
6.3 (43.3) |
11.2 (52.2) |
| Record low °C (°F) | −4.1 (24.6) |
−3.9 (25.0) |
−2.2 (28.0) |
1.2 (34.2) |
4.7 (40.5) |
7.0 (44.6) |
11.1 (52.0) |
12.9 (55.2) |
8.0 (46.4) |
1.8 (35.2) |
−1.3 (29.7) |
−2.9 (26.8) |
−4.1 (24.6) |
| Average precipitation mm (inches) | 89.7 (3.53) |
57.7 (2.27) |
69.9 (2.75) |
73.8 (2.91) |
63.1 (2.48) |
29.5 (1.16) |
10.9 (0.43) |
27.4 (1.08) |
70.8 (2.79) |
106.2 (4.18) |
148.8 (5.86) |
116.9 (4.60) |
864.7 (34.04) |
| Average precipitation days (≥ 1.0 mm) | 8.5 | 7.4 | 7.7 | 8.0 | 6.0 | 3.8 | 1.2 | 2.7 | 6.4 | 8.2 | 10.8 | 10.7 | 81.4 |
| Source: Météo France[3] | |||||||||||||
Calzola bridge
The Calzola bridge, at the border with Casalabriva, has two bends seemingly due to a misalignment of the two extremities of the bridge.
Population
| Year | Pop. | ±% |
|---|---|---|
| 1962 | 461 | — |
| 1968 | 488 | +5.9% |
| 1975 | 408 | −16.4% |
| 1982 | 305 | −25.2% |
| 1990 | 265 | −13.1% |
| 1999 | 278 | +4.9% |
| 2008 | 283 | +1.8% |
See also
References
- ↑ "Répertoire national des élus: les maires". data.gouv.fr, Plateforme ouverte des données publiques françaises (in French). 2 December 2020.
- ↑ "Populations légales 2021". The National Institute of Statistics and Economic Studies. 28 December 2023.
- ↑ "climate of Pila-Canale 1981-2010" (PDF) (in French). Météo-France. Retrieved 2 June 2022.